


By CryptoTotem Research · Data verified through August 24, 2026 · 14-minute read
What The Evidence Supports
- Market boundary: The liquidation cascade began on October 10, 2025 UTC and unwound more than $19 billion in leveraged positions within 24 hours.
- Bear-market backdrop: Total crypto market capitalization ended Q2 2026 at $2.1 trillion, approximately 52% below its October 2025 peak.
- Project cohort: CryptoTotem added 686 profiles through August 24, 2026. DeFi was the largest primary industry at 144 profiles, or 21.0%.
- Financing: Of 314 entries from external reports, 302 disclosed numeric amounts. The 20 largest represented 55.9% of the approximately $9.20 billion disclosed in those sources.
- Token outcomes: The register contained 178 TGEs. Among 177 tokens with numeric multiples, the median was 0.30x and only 19.2% traded at or above 1.0x.
- Launch access: Regulatory reviews, promotion rules, and product-specific licensing remained material launch and distribution constraints.
Reading rule: These findings come from separate datasets that do not describe the same projects. They should not be read as one merged sample or as proof that the flash crash caused later financing, profile activity, or token outcomes.
Research notice: This article analyzes platform records and disclosed market data. It is not investment, legal, or tax advice. Crypto assets can lose all their value. Past or snapshot performance does not predict future returns. CryptoTotem operates the project-profile platform and supplied the proprietary research cohort.
Contents
- October 10 is the market anchor
- Scope and sources
- 686 crypto project profiles after the crash
- DeFi gained industry share
- Reported financing was concentrated in the covered sources
- Tracked token launches continued; snapshot outcomes were weak
- Regulatory Access Became a Launch Constraint
- Delays and shutdowns reveal two different risks
- A practical framework for researchers and investors
- Conclusion
- Scope notes
- Publisher disclosure and corrections
October 10 Is The Correct Market Anchor
The flash crash began on October 10, 2025 UTC. Some reports use October 10 – 11 because the liquidation cascade crossed local calendar dates and trading continued into the next session.
Bitcoin traded near $121,000 on the morning of October 10, then briefly reached $107,000. Ether fell from almost $4,800 to $3,500. More than $19 billion of leveraged positions were liquidated, while some long-tail altcoins lost 50% – 75% within minutes.
CoinDesk Data’s independent index review also identifies October 10 as the largest liquidation event in crypto history, with $19 billion in notional positions unwound within 24 hours.
The weakness persisted beyond the event. CoinGecko’s Q1 report put total crypto market capitalization at $2.4 trillion at quarter-end, down 20.4% for the quarter and about 45% from the October 2025 peak. Its Q2 report recorded another 12.6% decline to $2.1 trillion, approximately 52% below that peak. The two quarterly percentages are sequential changes and should not be added.
High leverage combined with thin order book depth and one macro headline sparked the crash.
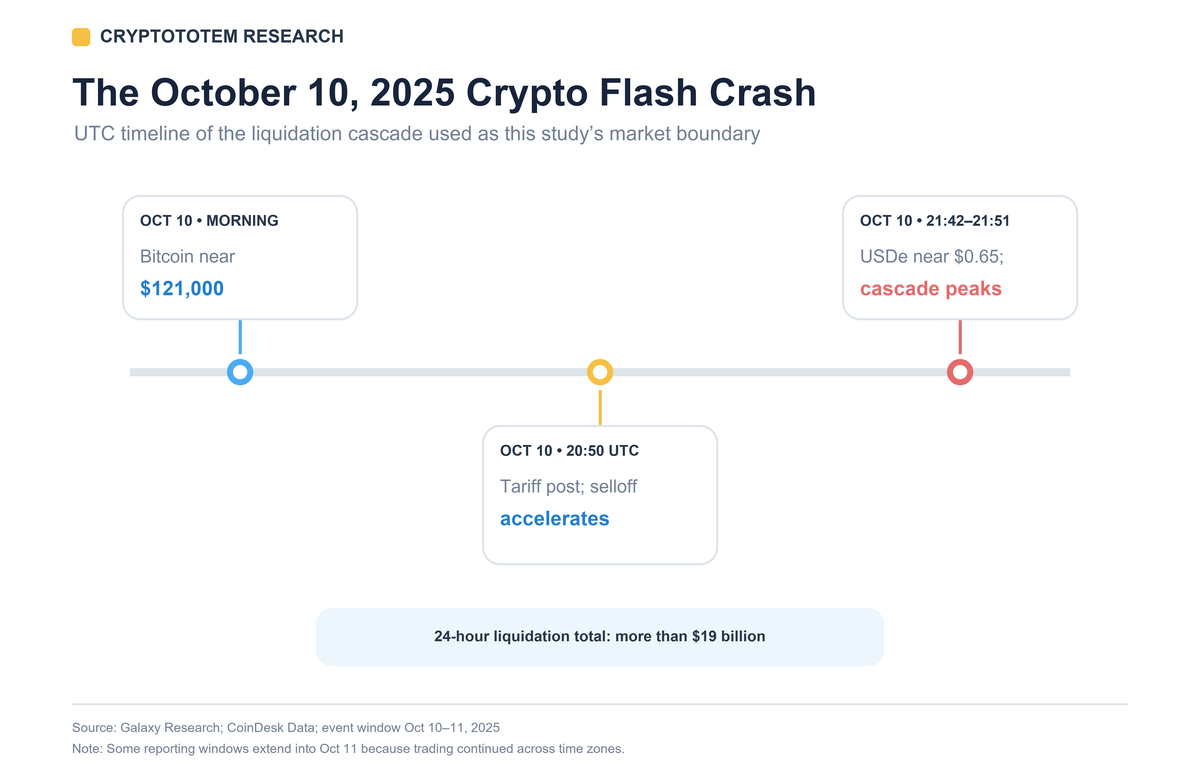
October 10 was the liquidation event used as the research boundary
This study uses October 10 as a time boundary, not as a causal explanation for each later project launch, financing, or TGE.
Section finding: October 10, 2025 UTC is the event date and research boundary.
Scope And Sources
The analysis uses three independent views without merging their denominators. The proprietary layer comes from the CryptoTotem ICO list and project profiles. External financing and token data provide separate cross-checks.
Research design in six numbers
| Metric | Result | What it measures |
|---|---|---|
| CryptoTotem research cohort | 686 project profiles | Profiles added October 10, 2025 – August 24, 2026 |
| Largest industry | DeFi: 144 profiles / 21.0% | Primary CryptoTotem industry in the research cohort |
| Reported financing | 302 entries with disclosed amounts / approximately $9.20 billion | Covered-source sum from reports spanning November 2025 – June 2026 |
| Capital concentration | Top 20 entries: 55.9% | Share of the total disclosed amount in the 20 largest entries |
| Tracked token launches | 178 TGEs | October 11, 2025 – August 19, 2026 |
| Median token ROI | 0.30x | Current price divided by sale or reference price; n=177 |
Source: CryptoTotem project-profile data, external financing reports, and ICO Analytics-derived TGE data. Figures refer to separate samples and should not be added together.
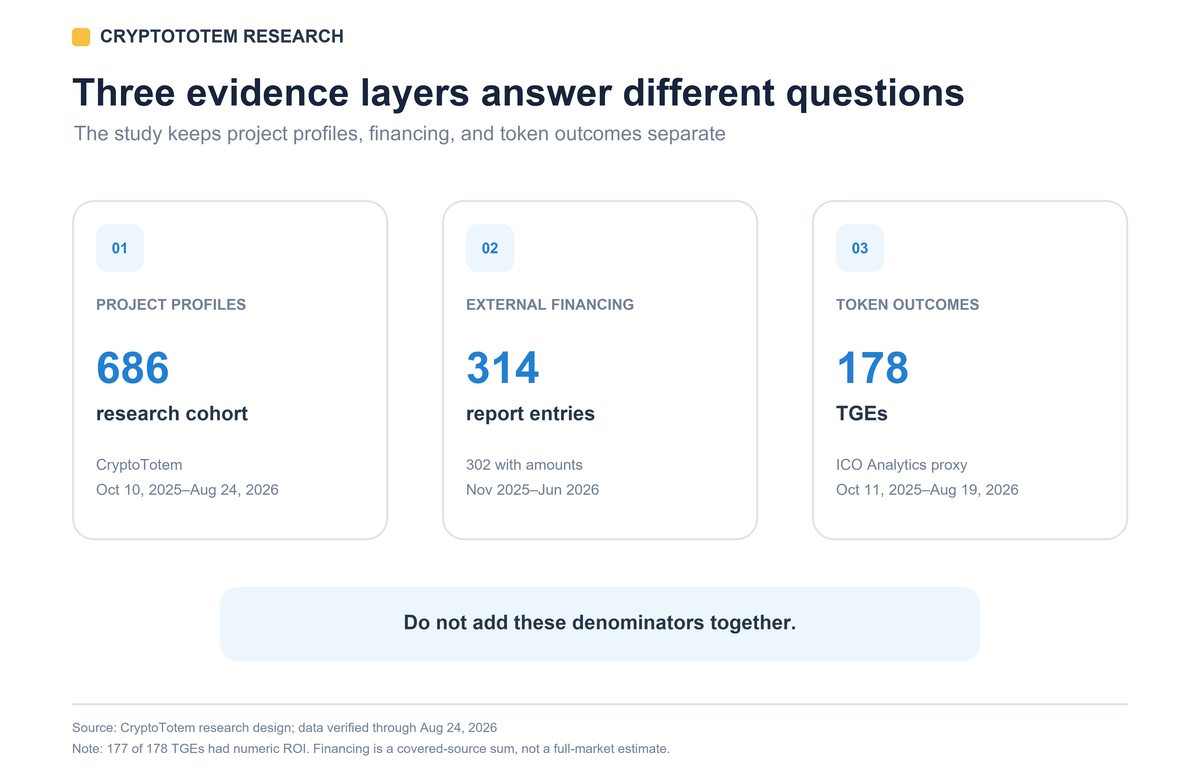
Project profiles, entries from external financing reports, and token outcomes measure different parts of the market
Research layers, periods, and limits
| Layer | Period | Sample | Valid inference | Invalid inference |
|---|---|---|---|---|
| CryptoTotem project profiles | Earlier: Jan. 1 – Oct. 9, 2025; research: Oct. 10, 2025 – Aug. 24, 2026 | 531 earlier profiles; 686 research-cohort profiles | Industry mix and sale formats among published profiles | Companies founded or every project created worldwide |
| External financing reports | Source-report months: Nov. 2025 – Jun. 2026 | 314 report entries; 302 with numeric disclosed amounts | Total disclosed amount and concentration in the covered sources | Total market VC or 314 independently verified venture rounds |
| TGE register | Oct. 11, 2025 – Aug. 19, 2026 | 178 TGEs; 177 with numeric ROI | Tracked launch frequency and snapshot price outcomes | Realized investor return after vesting, fees, and liquidity constraints |
Source and definitions: CryptoTotem project profiles, reviewed external financing reports, and ICO Analytics. A profile date is when the profile appeared on CryptoTotem; it is not a founding, financing, sale, TGE, or exchange-listing date. ROI equals current price divided by the sale or platform reference price.
Use the three layers separately: profiles show industry and sale-format mix within CryptoTotem’s coverage, financing reports show where disclosed capital clustered, and the TGE register shows snapshot token outcomes. Mixing them would create a false market picture.
The profile windows differ in length. Only within-cohort industry shares, not raw profile totals, are compared.
Section finding: Each dataset answers a different question; their denominators are not combined.
686 Crypto Project Profiles After The Crash
CryptoTotem added 686 crypto project profiles from October 10, 2025 through August 24, 2026. This measures platform additions, not company formation or every crypto project created worldwide.
Separately, 281 CryptoTotem profiles had at least one sale starting on or after October 10. Of those, 276 were in the 686-profile research cohort and five had appeared earlier. Sale format is multi-value, so one project can appear in more than one row.
Sale formats among 281 profiles with a sale start on or after October 10
| Sale format | Profiles | Share of 281 |
|---|---|---|
| IDO | 135 | 48.0% |
| ICO | 81 | 28.8% |
| Presale | 71 | 25.3% |
| IEO | 39 | 13.9% |
Note: Shares exceed 100% in total because formats overlap. A sale start is not a TGE or exchange-listing date.
Section finding: CryptoTotem recorded continued profile and sale activity after October 10; profile count does not measure company formation or project quality.
DeFi Gained Industry Share
The industry mix changed relative to the earlier comparison cohort. DeFi became the largest primary industry, rising from 14.3% to 21.0% of profiles. AI remained second, but its share fell from 24.7% to 20.0%. Broad “Blockchain” labeling fell by 5.2 percentage points.
Largest primary-industry shifts
| Primary industry | Earlier profiles | Earlier share | Research profiles | Research share | Change |
|---|---|---|---|---|---|
| DeFi | 76 | 14.3% | 144 | 21.0% | +6.7 pp |
| AI Agents | 46 | 8.7% | 70 | 10.2% | +1.5 pp |
| Meme | 27 | 5.1% | 38 | 5.5% | +0.5 pp |
| Gaming | 46 | 8.7% | 34 | 5.0% | −3.7 pp |
| AI | 131 | 24.7% | 137 | 20.0% | −4.7 pp |
| Blockchain | 92 | 17.3% | 83 | 12.1% | −5.2 pp |
Note: One primary industry per profile. DeFi, AI, Blockchain, and AI Agents accounted for 434 of 686 research-cohort profiles, or 63.3%.
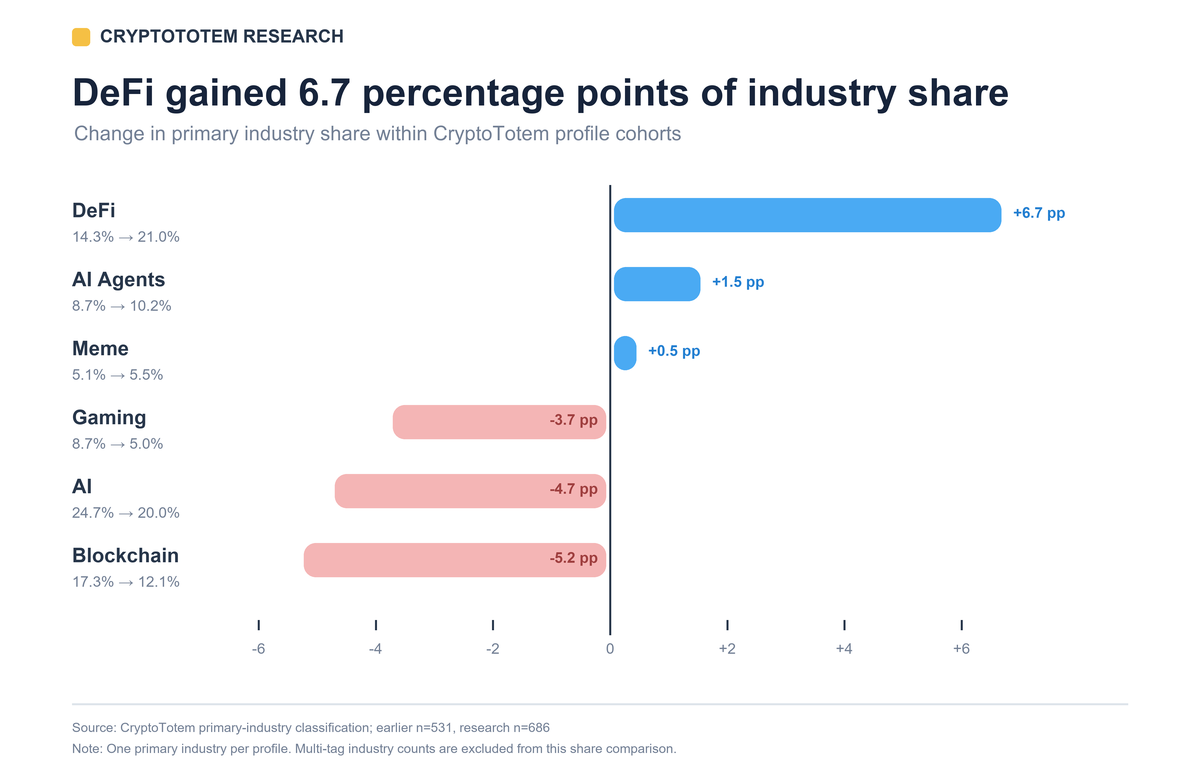
The largest shift was toward DeFi, not a uniform increase across industries
The result is directional. “AI,” “AI Agents,” and “Blockchain” are CryptoTotem industry classifications, not standardized market sectors. Counts should be compared within this dataset, not mechanically joined to other taxonomies.
Section finding: CryptoTotem’s research-cohort profile mix favored DeFi and AI-agent projects; broad AI, blockchain, and gaming labels lost relative share.
Reported Financing Was Concentrated In The Covered Sources
The external financing layer contained 314 reported entries spanning November 2025 through June 2026. Of these, 302 disclosed numeric amounts totaling approximately $9.20 billion. The entries include equity, strategic, debt, token, and undisclosed structures. This is a covered-source sum, not a market-wide funding estimate and not a count of 314 independently verified legal closings.
The 10 largest entries with disclosed amounts represented $3.91 billion, or 42.5% of the total disclosed amount. The top 20 represented $5.14 billion, or 55.9%. RaiseKit’s monthly reports supplied the long-tail source layer; official announcements were used for the cases below.
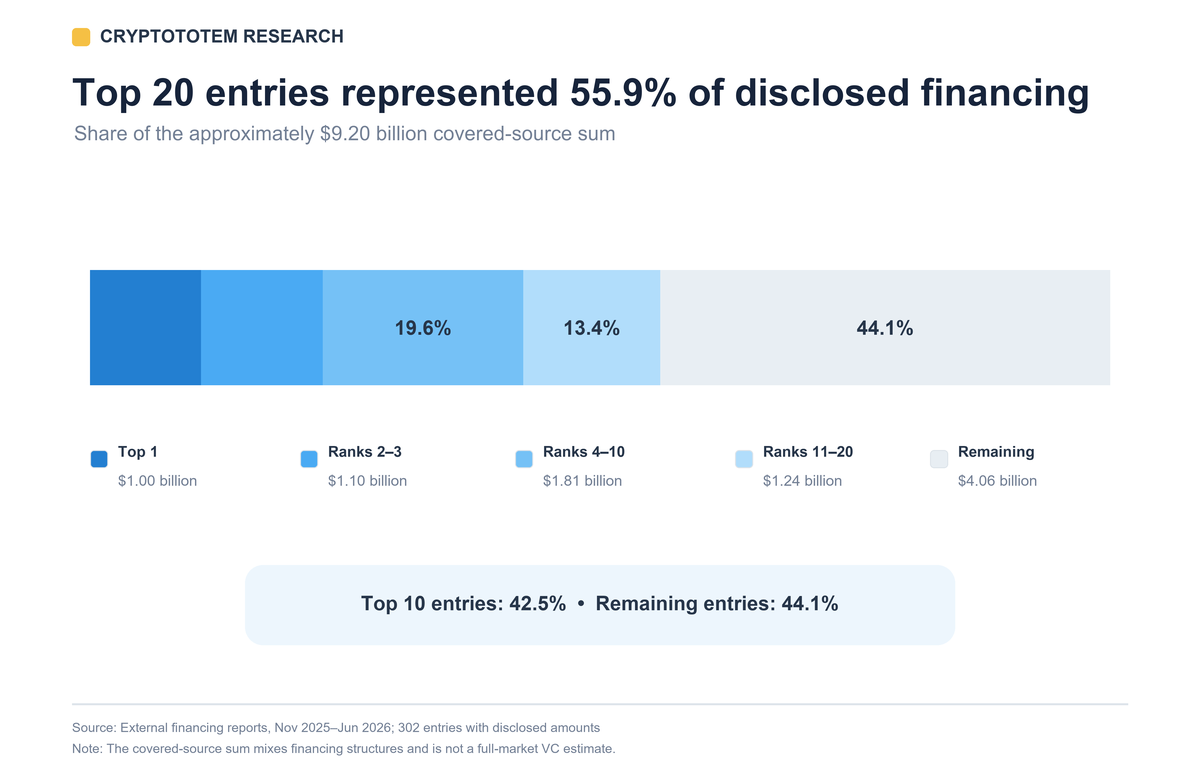
More than half of the total disclosed amount was concentrated in 20 entries
The source-report industry labels show where the disclosed amounts clustered. Exchange entries accounted for $2.78 billion, payments for $2.13 billion, infrastructure for $1.16 billion, and DeFi for $0.98 billion. Together, these four labels represented $7.05 billion, or 76.6% of the covered-source total.
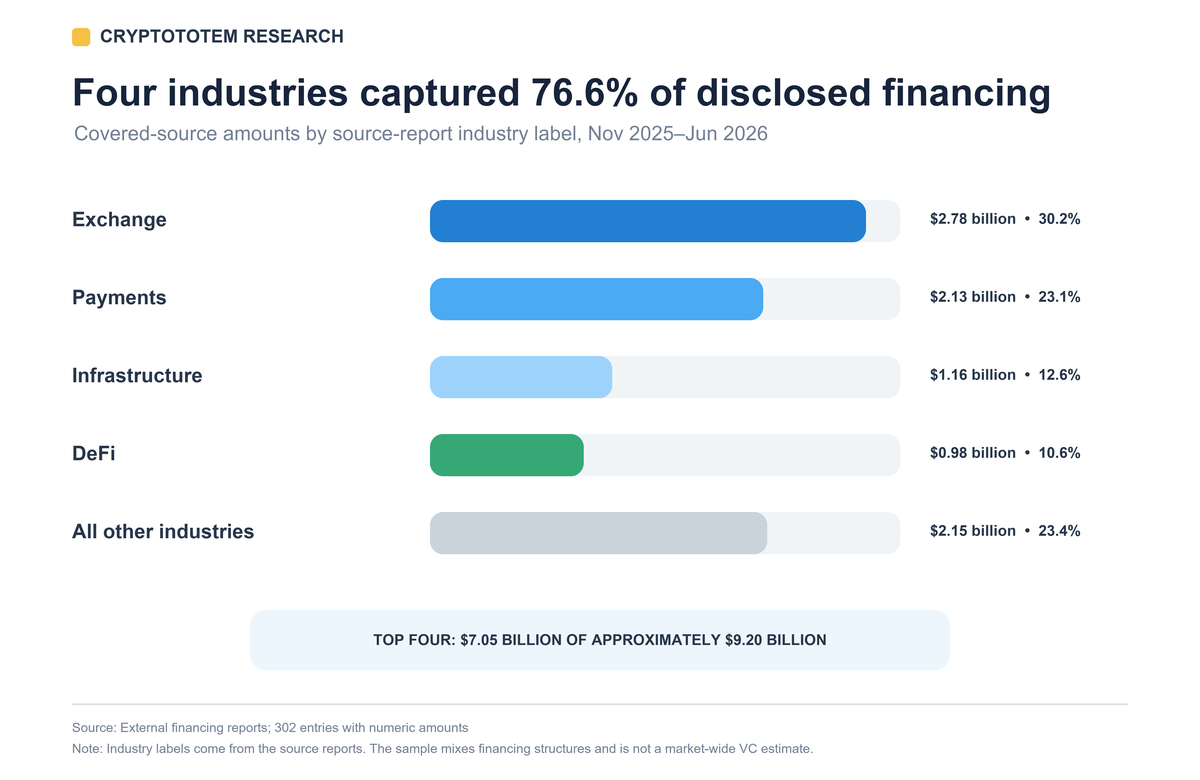
Four source-report industry labels accounted for more than three-quarters of the disclosed amount
These labels mix financing structures and are not standardized market sectors. They show concentration within the covered reports, not each industry’s share of global venture capital.
Broader market reports show the same selectivity. Galaxy’s Q4 2025 venture report counted $8.5 billion across 425 deals. Eleven rounds above $100 million supplied $7.3 billion, or 85% of quarterly capital. Galaxy’s Q1 2026 report then recorded $4.0 billion across 355 deals: capital fell 50% quarter over quarter and deal count fell 16%. Yet later-stage companies received 57% of invested capital, and the median crypto deal size reached a series high above $4.5 million. Larger median checks therefore coexisted with fewer deals.
Taxonomy can move the total more than market direction. CryptoRank’s Q2 2026 analysis reported $4.99 billion across 218 VC deals, but $12.86 billion across 271 transactions after adding debt, acquisitions, public financing, and other structures. Its July 2026 recap counted $1.36 billion across 41 VC rounds; the top 10 captured 85%.
The closest reported mega-round to the event boundary came one week later. On October 17, Fortune reported, citing people familiar with the matter, that payments-focused blockchain Tempo had raised a $500 million Series A at a $5 billion valuation. October 17 is the report date, not a verified closing date; the amount and valuation were not issuer-confirmed.
The prediction-market financings also had operating context. The CoinGecko Q2 report cited above estimated $113.8 billion in notional prediction-market volume, with Kalshi at 58.9% market share and Polymarket at 30.2%. Notional turnover is not revenue, open interest, or capital invested.
Three Verified Large-Financing Cases
These three verified cases come from the separate external-financing layer; they are not presented as a subset of the 686 CryptoTotem profiles. Each had measurable distribution, transaction flow, or regulated market access.
Selected external financing cases from the post-boundary period
| Company | Official event | Amount | Operating evidence at announcement | Research interpretation |
|---|---|---|---|---|
| Kalshi | Series F, May 7, 2026 | $1.0 billion at a $22 billion valuation | Company-reported institutional volume up 800% in six months | Regulated prediction-market financing; not a token sale |
| Polymarket | Strategic investment, March 27, 2026 | $600 million from ICE | Exchange and data-distribution partnership | Strategic infrastructure capital; not equivalent to venture breadth |
| Rain | Series C, January 9, 2026 | $250 million at a $1.95 billion valuation | Company-reported more than $3 billion in annualized transaction volume and 200+ partners | Payment-infrastructure financing supported by company-reported usage metrics |
Source treatment: Round amount and date come from primary announcements. Operating metrics are company claims unless stated otherwise.
There are few categories in recent history that have scaled this quickly outside of AI.”
Intercontinental Exchange’s official Polymarket investment announcement confirms the $600 million amount. It should be classified as a strategic investment, not automatically added to a pure VC series.
Stablecoins are quickly becoming the way money moves in the 21st century, but adoption by users worldwide requires cards and apps that just work.
Section finding: The covered reports and verified cases show capital concentrated in market access, payments, and infrastructure; they do not establish a broad recovery in token financing.
Tracked Token Launches Continued; Snapshot Outcomes Were Weak
The TGE register starts on October 11, the first full UTC day after the event date, and records 178 launches through August 19, 2026. Activity was front-loaded: 31 TGEs occurred in the partial October period and 33 in November. The count fell to six in June, five in July, and four through August 19.
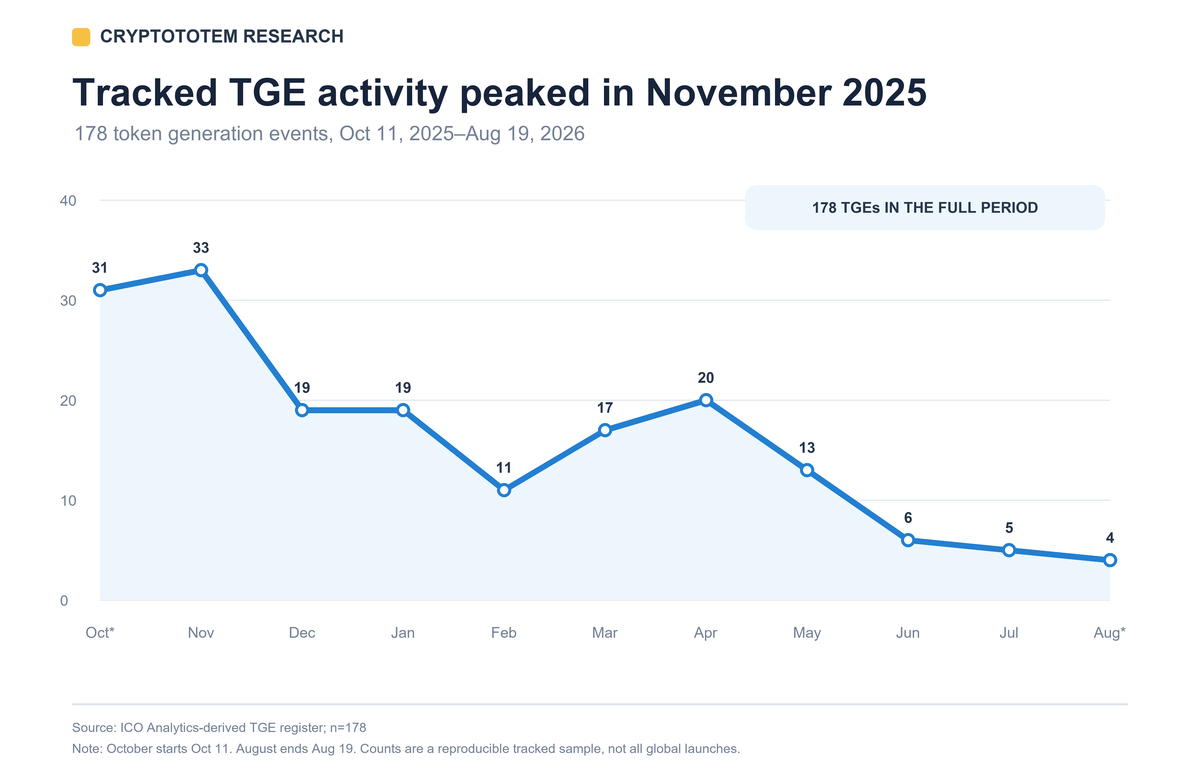
Launches continued after the crash, but the tracked monthly count thinned during 2026
Numeric ROI was available for 177 tokens. The median was 0.30x, meaning the middle token traded 70% below its sale or reference price. The mean was 0.93x and was pulled upward by outliers.
Token outcome distribution on August 24, 2026
| Metric | Count | Share or value |
|---|---|---|
| Numeric ROI available | 177 | 100% |
| At or above 1.0x | 34 | 19.2% |
| At or above 2.0x | 9 | 5.1% |
| At or below 0.1x | 54 | 30.5% |
| Median ROI | Not applicable | 0.30x |
| Mean ROI | Not applicable | 0.93x |
| Median drawdown from ATH | 177 | −84.9% |
| Drawdown of at least 90% | 69 | 39.0% |
Source: CryptoTotem calculation from the ICO Analytics statistics register. Market fields were verified on August 24, 2026. Reference-price definitions vary by project. ROI metrics use n=177; ATH-drawdown metrics use a separate n=177; 176 records contained both.
These figures describe token-price snapshots, not investor outcomes. They exclude vesting, lockups, fees, slippage, liquidity depth, and whether a participant could actually buy at the reference price.
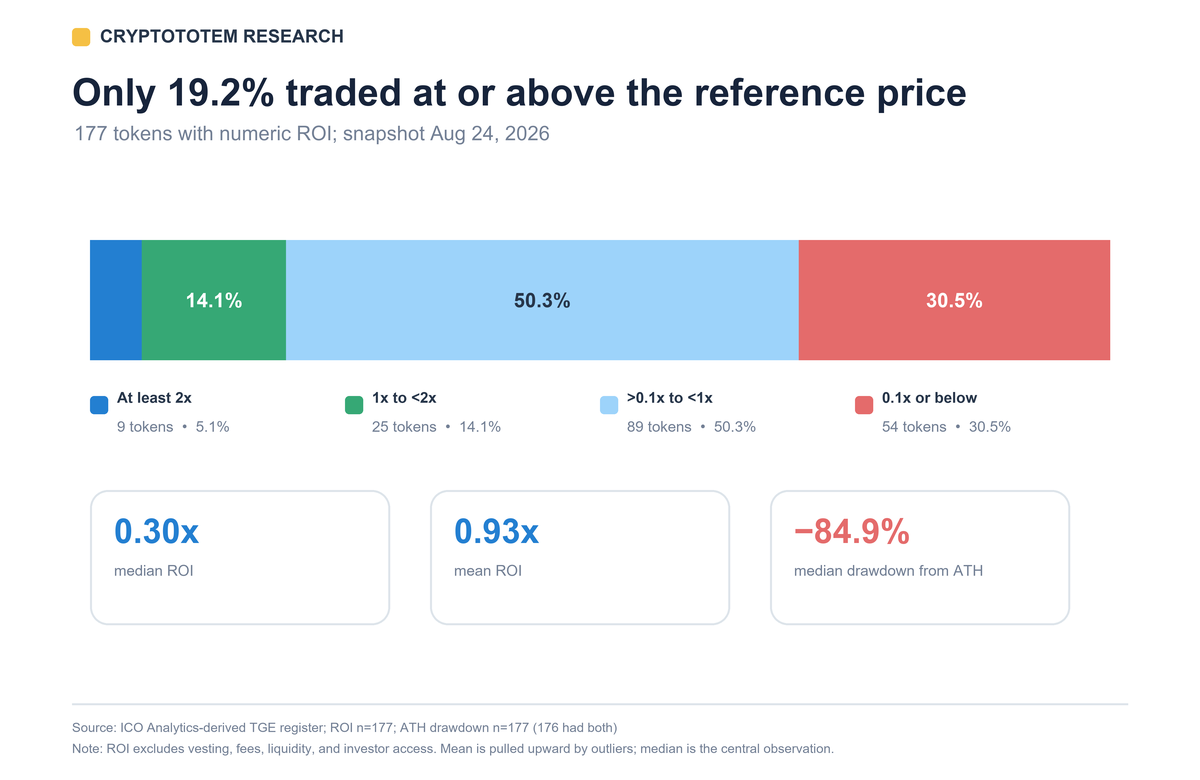
The median and hit rate are more informative than the outlier-sensitive mean
An independent 2025 cohort points in the same direction. Memento Research tracked 118 token launches: 100 traded below TGE valuation by December 20, 2025, and the median FDV change was −71.1%. None of 28 launches that began at a fully diluted valuation of at least $1 billion remained positive in that snapshot.
Section finding: Issuance continued, but the August 24 snapshot was weak: 80.8% of tracked tokens traded below reference price.
Regulatory Access Became a Launch Constraint
Regulatory readiness can turn a technically ready launch into a distribution problem. The practical question is not only whether the token contract works, but whether the issuer or service provider can promote, sell, or provide the relevant service in its target markets. The European Securities and Markets Authority’s MiCA materials set disclosure and authorization expectations across the European Union. The UK Financial Conduct Authority’s crypto-promotion rules apply to promotions capable of reaching UK consumers. In the United States, the SEC’s disclosure statement for crypto-asset securities offerings emphasizes business, token-rights, technology, and risk disclosures.
Singapore adds a narrow but consequential cross-border rule. From June 30, 2025, the Monetary Authority of Singapore required Singapore-based digital-token service providers serving only overseas customers in regulated token activities to hold a license; without one, the activity had to cease. MAS said the licensing bar would be high. Services limited to utility or governance tokens were outside that new regime.
Stablecoin issuers face product-specific controls. Hong Kong’s fiat-referenced stablecoin licensing regime took effect on August 1, 2025. The HKMA supervision guideline covers reserve management and safekeeping, redemption at par, governance, risk controls, and related operating requirements. The regime applies to covered issuers, not every stablecoin, exchange, or Web3 company.
On March 19, 2026, YOM announced a TGE delay while completing a MiCA review, Digital Token Identifier, and Legal Entity Identifier work. The post said Europe represented 50%–60% of its community.
We launch globally, or we don’t launch.
That is a project statement, not proof that every listed compliance step was legally required in every market. It shows how regulatory access can become a launch dependency.
Section finding: Regulatory access and product-specific licensing can determine whether a technically ready project can launch and reach its target markets.
Delays And Shutdowns Reveal Two Different Risks
A delayed TGE is not automatically a failure. Acurast announced on November 14, 2025 that it had postponed its technically ready November 17 TGE after reviewing market conditions. It then launched its mainnet and TGE on January 20, 2026. In the frozen August 24 ICO Analytics snapshot, ACU was $0.107 against a $0.09 reference price, or approximately 1.2x. That sequence does not prove waiting improved returns; it shows why postponement should not be recorded as failure.
A launch can move because of compliance, exchange integration, liquidity, holder distribution, or market conditions.
A shutdown is different. It tests product-market fit, sustainable demand, and operating economics. Botanix, a Bitcoin Layer 2, announced a wind-down after nearly four years of work and more than a year on mainnet. Its team said the protocol and applications worked, but demand did not support the thesis on the required timeline.
The dominant strategy for bootstrapping a new chain does not work right now
Two research errors are easy here. First, a postponed date is not a failed launch. Second, a functioning protocol is not proof of product-market fit.
Section finding: Timing risk concerns market access; shutdown risk concerns whether real demand can sustain the product.
A Practical Framework For Researchers And Investors
The post-crash market is easier to read when projects are classified by evidence, not narrative. Similar post-crash headlines can describe very different risk profiles: a regulated operating company, a live token, or a delayed TGE.
Four post-crash project archetypes
| Archetype | Primary evidence | Main risk | Next verification step |
|---|---|---|---|
| Operating company with private capital | Official round, identifiable investors, usage or revenue evidence | Valuation and operating-metric quality | Verify legal entity, round structure, and independently observable adoption |
| Protocol with a live token | Contract, circulating supply, vesting, liquidity, and market data | High FDV, low float, unlocks, and thin order books | Recalculate market cap, FDV, holder concentration, and executable liquidity |
| Pre-TGE project | Product status, legal disclosures, sale terms, and launch dependencies | Delay, cancellation, listing, and distribution risk | Separate intended date from confirmed TGE and listing dates |
| Early-stage project | Early product, community, or planned token | Execution, liquidity, and launch-timing risk | Confirm primary documents, operating milestones, and launch dependencies |
Before adding a project to a due-diligence watchlist, answer seven questions:
- Is the entity, team, and jurisdiction identifiable?
- Is the financing amount new capital, cumulative funding, debt, a token sale, or a strategic transaction?
- Does a primary source confirm the date, amount, and investors?
- If a token exists, which reference price is used, and was that price accessible?
- What percentage of supply circulates, and when do major unlocks occur?
- Is usage independently observable, or only company-reported?
- Which event would invalidate the project thesis?
A research watchlist can therefore be catalyst-specific, not price-target driven. Useful catalysts include a completed compliance review, a confirmed TGE, executable liquidity, a product launch, verifiable revenue, or a major distribution integration. Each needs a deadline and an evidence source.
Section finding: A project becomes researchable when its entity, capital, token economics, and measurable demand can be checked independently.
Conclusion
CryptoTotem added 686 crypto project profiles during the research period. DeFi was the largest primary industry at 21.0%, and 281 profiles separately had at least one sale starting on or after October 10.
The broader liquid market ended Q2 2026 approximately 52% below its October peak. Still, the external financing layer contained 314 entries, including 302 numeric amounts totaling approximately $9.20 billion. Capital was concentrated: the 20 largest entries represented 55.9% of that amount, while exchange, payments, infrastructure, and DeFi entries together represented 76.6%.
At the August 24 snapshot, the median tracked token traded at 0.30x its sale or reference price. Only 19.2% traded at or above 1.0x, and 39.0% had fallen at least 90% from their all-time high.
The post-crash market did not stop; it separated. CryptoTotem continued adding project profiles, private financing favored concentrated infrastructure and market-access bets, most tracked public tokens remained weak, and regulatory access shaped which projects could launch and distribute.
Scope Notes
- Data was verified through August 24, 2026.
- The 686 profiles measure CryptoTotem coverage, not all crypto startups worldwide.
- The financing total is a covered-source sum and includes multiple financing structures; it is not a market-wide estimate.
- Company operating metrics are labeled as company-reported.
- ROI uses a sale or platform reference price and is not realized investor P&L.
Publisher Disclosure And Corrections
CryptoTotem operates the crypto project-profile platform, offers commercial listing and advertising services, and supplied the proprietary research cohort. The cohort may include projects with commercial placements. Commercial status was not used to calculate the profile, industry, financing, TGE, or return findings. Inclusion is not an endorsement.
Editorial responsibility rests with CryptoTotem Research. Send factual corrections through the CryptoTotem feedback page or to [email protected]. Corrections should identify the claim, source, and relevant freeze date.